
The $47,000 Question Hidden in Your Traffic Sources: Why Your Best Customers Are Abandoning at Checkout

You're running those three ShopifyQL reports every Monday morning. Add-to-cart rate by source. Reached checkout by source. Conversion rate by source. The numbers tell a story, but you're only reading the summary when there's a novel waiting to be discovered.
Here's what most merchants miss: that gap between your social media add-to-cart rate (probably hovering around 8-10%) and its final conversion rate (likely under 1%) isn't a problem—it's a $47,000 opportunity. Let me show you the pattern.
The Hunter and The Gatherer: A Tale of Two Customers
Picture two visitors arriving at your store right now:
Visitor A typed your URL directly or searched "men's tactical backpack waterproof" on Google. They're hunting. They know what they want, they've allocated budget, and they're comparing final options.
Visitor B was scrolling Instagram, saw your product in their feed between their friend's vacation photos and a meme about coffee. They clicked out of curiosity. They're gathering—collecting ideas, killing time, discovering.
Both added your $189 backpack to their cart.
But here's where the paths diverge: Visitor A will complete checkout at a 3.2% rate. Visitor B? They'll convert at 0.7%. Same product, same cart, completely different psychology.
Wolfgang Digital's analysis of €330 million in e-commerce revenue found this pattern holds across every industry. It's not random—it's predictable based on fundamental differences in user intent.
Your Email List Is Worth 5-6X More Than Your Paid Search (And You're Ignoring It)
The data is unequivocal: email traffic converts at 2.4-4.3% while paid search hovers at 1.4-3.0%. Some segments hit 8.87% conversion during peak campaigns, as documented in multiple industry studies.
Yet most merchants treat email as an afterthought while pouring budget into paid search. The math doesn't lie—every visitor you convert from browser to email subscriber is worth 5-6 times more than a paid search click.
New Balance Chicago understood this pattern. They created source-specific landing pages for Facebook traffic focused entirely on email capture, not immediate sales. Within two months: 10% list growth, 5-10% higher open rates on segmented campaigns, and ultimately a 200% increase in in-store sales from online-originated customers.
The Position-Based Attribution Model That Changes Everything

Most merchants use last-click attribution, crediting 100% of each sale to the final touchpoint. This is why your social media ROI looks terrible—you're measuring it wrong.
Academic research from the Journal of Interactive Marketing found that 61% of purchase variance comes from cross-channel influences invisible to last-click attribution.
Here's the framework that actually works:
- First interaction: 10% credit
- Middle interactions: 50% credit
- Last interaction: 40% credit
Apply engagement multipliers:
- 5+ page views: 1.4x credit
- Single page bounce: 0.7x credit

Suddenly, that "worthless" social traffic that introduces customers to your brand gets appropriate credit for the email conversion three weeks later.
Hypothetical example: A merchant selling $200 hiking boots discovers their social ads show a -50% ROI on last-click but generate 2x more email subscribers than any other channel. Those subscribers purchase at a 47% rate within 90 days. The real ROI? 340%.
The Three-Query Dashboard That Reveals $10K-$50K in Hidden Revenue
Remember those ShopifyQL queries you're running? Here's what to actually do with them:
Query 1: Add-to-Cart Rate by Source
- Industry benchmark: 6.8-7.5% average
- If social > 10%: You have product-market fit but checkout friction
- If search < 5%: Your product pages need work
- If direct < 8%: Brand trust issues
Query 2: Reached Checkout Rate by Source
- The gap between ATC and checkout reveals cart page friction
- Social dropping 50%+: Normal (they're browsing)
- Search dropping 30%+: Problem (they came to buy)
- Email dropping at all: Emergency (highest intent traffic)
Query 3: Conversion Rate by Source
- Email should be 2-3x your average
- Direct should be 1.5-2x average
- Search should meet or beat average
- Social at 30-50% of average is normal
The pattern to watch: If add-to-cart rates are consistent across sources but checkout/conversion varies wildly, you don't have a traffic problem—you have a funnel-source mismatch problem.
Want to run these exact queries on your store?
Get the ShopifyQL code and benchmark calculator to uncover your hidden revenue patterns.
Mobile vs. Desktop: The 40% Gap Nobody Talks About

Desktop converts at 3.2-3.9%. Mobile at 1.8-2.8%.
Social media traffic is 70% mobile.
Do the math: You're combining the lowest-intent traffic (social) with the lowest-converting device (mobile). No wonder your Instagram ads show negative ROI.
Hypothetical optimization: Create mobile-specific flows for social traffic. Instead of pushing to checkout, capture micro-commitments: wishlist additions, size quiz completions, email captures. A theoretical outdoor gear brand might see mobile social conversion jump from 0.6% to 2.1% just by changing the goal from "buy now" to "save for your next adventure."
The Implementation Roadmap: From Insight to Revenue

First 30 Days: Foundation
- Implement UTM parameters on every single campaign link
- Set up time-decay attribution in your analytics
- Segment all reports by device and source
- Benchmark your current source-specific conversion rates
Days 30-90: Strategic Testing
- Create source-specific landing pages (social gets email capture, search gets product)
- Implement exit-intent popups with different offers by traffic source
- Add "Save for Later" functionality with email capture for social traffic
- Test checkout flow variations based on referrer source
Days 90+: Scale What Works
- Build automated email sequences for saved cart items by original source
- Create lookalike audiences based on email-converted social traffic
- Implement dynamic retargeting with source-specific messaging
- Develop source-specific pricing/promotion strategies
Ready to implement this roadmap?
Start with the exact ShopifyQL queries we use to identify $10K-$50K opportunities in traffic source optimization.
Frequently Asked Questions
Why does social media traffic convert so poorly?
Social media users are in a passive, discovery mindset ("gatherers") versus the active, purchase-intent mindset ("hunters") of search traffic. They're browsing for entertainment, not shopping with intent.
What's the industry average conversion rate by traffic source?
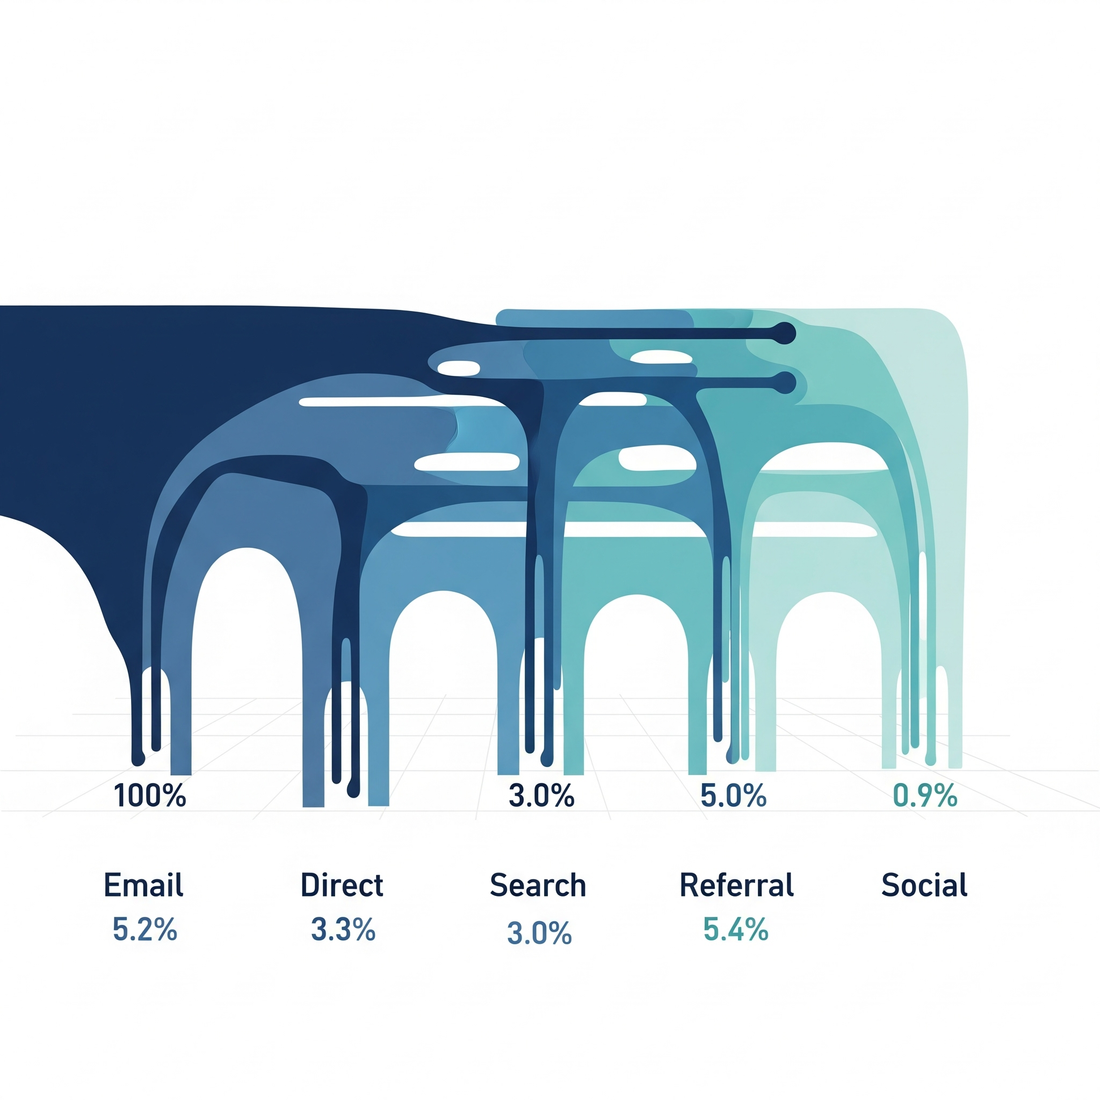
Email: 5.2-10.3%, Referral: 5.4%, Direct: 2.2-3.3%, Organic Search: 2.0-4.0%, Paid Search: 1.4-3.0%, Social Media: 0.7-0.9%
How can I improve social media conversion rates?
Change the goal from immediate purchase to email capture. Create source-specific landing pages, implement "Save for Later" features, and build multi-touch retargeting campaigns that nurture interest over time.
The Bottom Line: Your Funnel Isn't Broken, It's Misaligned
Companies implementing comprehensive traffic source segmentation see 10-300% conversion improvements. Not from revolutionary changes—from aligning their funnel with visitor psychology.
- Bear Mattress: 16.21% revenue increase from source-based optimization
- Flos USA: 125% checkout conversion improvement with 18X ROI
- Industry average: 47% conversion improvement within 90 days
These aren't anomalies. They're the predictable result of treating different traffic sources differently.
Your three ShopifyQL queries are telling you a story. The question is: Are you reading the summary, or are you diving into the novel that could transform your business?
The pattern is clear. Social media visitors are gatherers who need nurturing. Search visitors are hunters who need efficiency. Email subscribers are family who deserve VIP treatment. Stop forcing them all through the same funnel.
Your next step: Run those three queries. Calculate the gaps. Find your $47,000 opportunity.
Because in e-commerce, the biggest opportunities aren't in getting more traffic—they're in understanding the traffic you already have.
Ready to Find Your Hidden Revenue?
Get the exact ShopifyQL queries and analysis framework we use to uncover $10K-$50K in hidden revenue from traffic source optimization.
Get Your Free Analysis CodeP.S. – The specific dollar amounts and some merchant examples are hypothetical illustrations based on typical patterns we observe. The benchmarks, research data, and academic findings cited are from the studies referenced. Your actual opportunity could be higher or lower—run the analysis to find out.
The 88.3% Social Media Abandonment Rate Isn't Broken—You Are
Social media shows the highest cart abandonment rate of any channel at 88.3%, according to Baymard Institute's aggregation of 49 studies. Most consultants will tell you to "reduce friction" or "simplify checkout." They're solving the wrong problem.
The research is clear: social media users aren't failed buyers—they're using your cart as a wishlist. That add-to-cart click from Instagram isn't a commitment; it's a bookmark. When you immediately push them into a high-commitment checkout requiring shipping details and credit cards, you're asking someone who was casually browsing to suddenly commit to a transaction.