
32 Shopify Analytics Queries That Actually Find Conversion Problems
Published: September 16, 2025
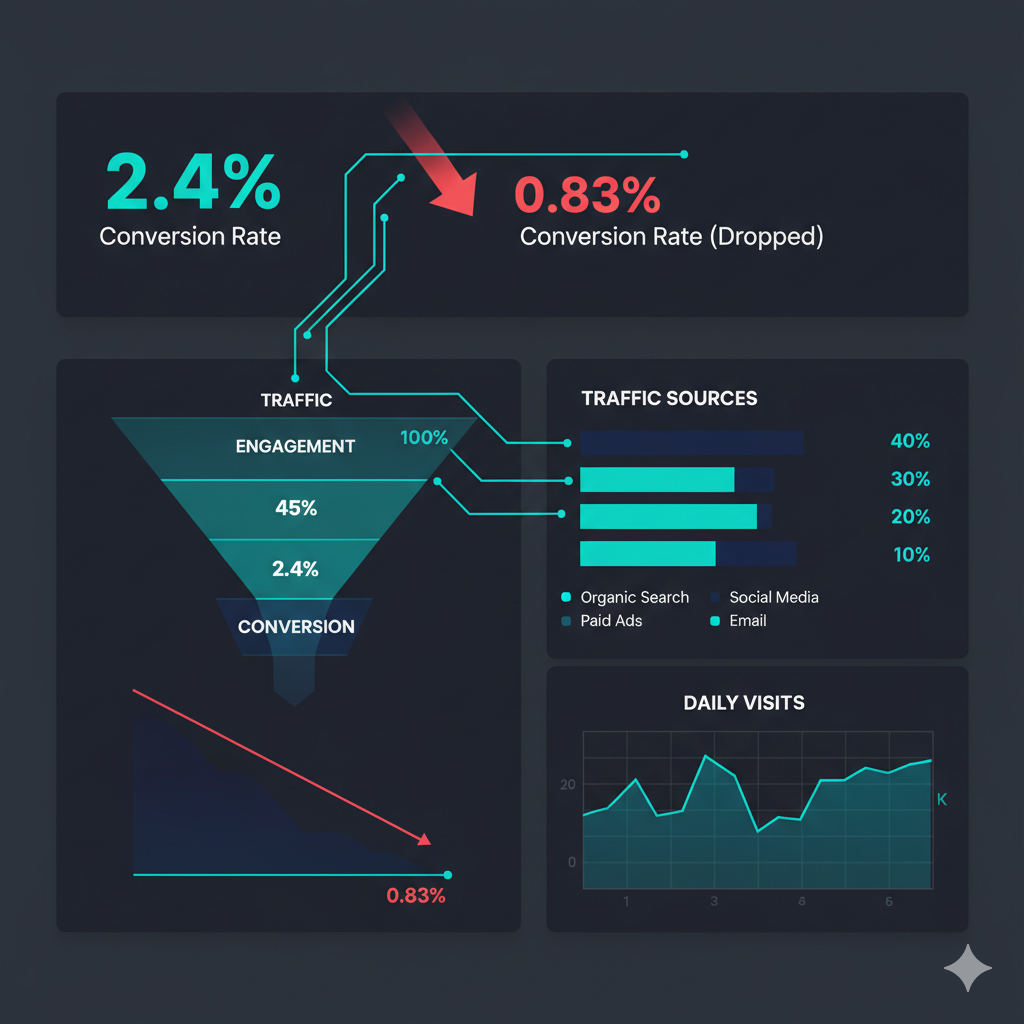
Saturday morning. Conversion rate: 0.83%. Yesterday it was 2.4%.
You check overall metrics. Everything looks "normal." Traffic's fine. Site's up. No obvious issues.
But something's killing conversions, and Shopify's default reports won't tell you where.
The Pattern Most Stores Miss:
Conversion problems hide in segments, not totals. It's never "everything is down." It's always "mobile social traffic from Canada is bouncing" or "search traffic to product pages after 8pm isn't converting."
The 32 queries below find these hidden killers in 15 minutes.
How to Run These Queries
- Go to your Shopify Analytics → Reports
- Click "Create custom report"
- Select "Explore" tab
- Paste any query below into the editor
- Click "Run query"
Pro tip: Save frequently-used queries as custom reports for one-click access during emergencies.
Quick Diagnostic Tool
Enter your metrics to get instant recommendations on which queries to run:
Industry Benchmarks (Know Where You Stand)
Good: 3%+ | Poor: <1.5%
Good: 2.5%+ | Poor: <1%
Good: 1.5%+ | Poor: <0.5%
Good: 4%+ | Poor: <2%
Phase 1: Initial Triage (Start Here When Conversion Tanks)
These first 7 queries isolate WHERE the problem is - which traffic source, what time, which step of the funnel.
Query 1: Today's Conversion Funnel by Source
Shows: Add-to-cart rate, checkout rate, and conversion rate by traffic source for today
Finds: Which traffic sources are failing in the conversion funnel
Benchmark: Look for sources below 1% conversion (red flag)
FROM sessions
SHOW added_to_cart_rate, reached_checkout_rate, conversion_rate
GROUP BY referrer_source
DURING today
ORDER BY conversion_rate DESC
Query 2: Compare to 30-Day Baseline
Shows: Daily conversion funnel metrics over 30 days with totals
Finds: Whether today's drop is unusual or part of a pattern
Benchmark: Drops >30% from baseline need immediate attention
FROM sessions
SHOW added_to_cart_rate, reached_checkout_rate, checkout_conversion_rate, conversion_rate
TIMESERIES day WITH TOTALS
SINCE -30d UNTIL today
ORDER BY day ASC
Query 3: Traffic Volume Check
Shows: Session count and visitor count by traffic source
Finds: Whether it's a traffic quality or traffic volume problem
Benchmark: If volume normal but conversion down = quality issue
FROM sessions
SHOW sessions, online_store_visitors
GROUP BY referrer_source WITH TOTALS
DURING today
Query 4: Site Performance Diagnostic
Shows: Session duration, bounce rate, and funnel metrics vs yesterday
Finds: Technical issues or user experience problems
Benchmark: Bounce rate >70% indicates major issues
FROM sessions
SHOW average_session_duration, bounce_rate, sessions, online_store_visitors, conversion_rate, sessions_with_cart_additions, sessions_that_reached_checkout, sessions_that_completed_checkout
DURING today
COMPARE TO previous_period
Query 5: Hourly Pattern Analysis
Shows: Sessions and conversion rates by hour
Finds: Time-specific issues (server problems, campaign timing, etc.)
Benchmark: Look for hours with 0% conversion during peak times
FROM sessions
SHOW sessions, conversion_rate
TIMESERIES hour WITH TOTALS
DURING today
ORDER BY hour ASC
Query 6: Geographic Breakdown
Shows: Sessions and conversion rates by country
Finds: International traffic diluting conversions or regional issues
Benchmark: Non-target countries should be <20% of traffic
FROM sessions
SHOW sessions, conversion_rate
GROUP BY session_country WITH TOTALS
DURING today
Query 7: Device Performance Split
Shows: Conversion rates for mobile vs desktop
Finds: Device-specific conversion issues
Benchmark: Mobile should be 70-80% of desktop conversion
FROM sessions
SHOW conversion_rate
WHERE session_device_type IN ('mobile', 'desktop')
GROUP BY session_device_type WITH TOTALS
DURING today
Troubleshooting Common Issues
Query returns no data
▶Cause: The date range or filter doesn't match any sessions.
Solution:
- Check your date range (use "SINCE -7d UNTIL today" for last week)
- Remove WHERE clauses to test if data exists
- Verify the exact product URL path if filtering by product
- Make sure you're using the correct field names (case-sensitive)
Conversion rate shows as 0% but I have sales
▶Cause: The query might be filtering too narrowly or looking at wrong date range.
Solution:
- Remove GROUP BY to see overall conversion first
- Check if orders were placed through different channels (POS, draft orders)
- Verify timezone settings in Shopify match your reporting expectations
- Use "SINCE -1d UNTIL today" to include full 24-hour period
"Field not found" error
▶Cause: Field name is incorrect or not available in your plan.
Solution:
- Double-check field spelling (it's "referrer_source" not "referral_source")
- Some fields require Shopify Plus or specific reporting features
- Use "FROM sessions SHOW *" to see all available fields
- Check Shopify's documentation for field availability by plan
Phase 2: Deep Dive Into Problem Areas
Once Phase 1 identifies the problem area (e.g., "mobile social traffic"), use these queries to get specific.
Mobile-Specific Diagnostics
Query 8: Mobile Conversion by Source
Shows: Mobile-only conversion rates by traffic source
Finds: Which sources fail specifically on mobile
Benchmark: Mobile should be 70-80% of desktop conversion rate
FROM sessions
SHOW conversion_rate
WHERE session_device_type = 'mobile'
GROUP BY referrer_source WITH TOTALS
DURING today
Query 9: Mobile 30-Day Baseline
Shows: Mobile conversion rates by source over 30 days
Finds: Normal mobile performance for comparison
Benchmark: Establish your normal mobile baseline
FROM sessions
SHOW conversion_rate
WHERE session_device_type = 'mobile'
GROUP BY referrer_source WITH TOTALS
SINCE -30d UNTIL today
Landing Page Diagnostics
Query 10: Landing Page Performance
Shows: Sessions and conversion rates by landing page
Finds: Which pages are conversion killers
Benchmark: Pages with >100 sessions and 0% conversion need immediate attention
FROM sessions
SHOW sessions, conversion_rate
GROUP BY landing_page_path, landing_page_url, landing_page_type WITH TOTALS
DURING today
Query 11: Zero-Conversion Pages
Shows: High-traffic pages with 0% conversion
Finds: Your biggest problem pages instantly
Benchmark: No page should have 0% with >50 sessions
FROM sessions
SHOW sessions, conversion_rate
GROUP BY landing_page_url WITH TOTALS
HAVING conversion_rate = 0
DURING today
ORDER BY sessions DESC
Query 12: Search Traffic Landing Pages
Shows: Where search traffic is actually landing
Finds: SEO/SEM landing page issues
Benchmark: Search should land on relevant product pages, not homepage
FROM sessions
SHOW sessions
WHERE referrer_source = 'search'
GROUP BY landing_page_url WITH TOTALS
DURING today
Query 13: Social Traffic Landing Pages
Shows: Where social traffic lands
Finds: Social campaign targeting problems
Benchmark: Social should land on campaign-specific pages
FROM sessions
SHOW sessions
WHERE referrer_source = 'social'
GROUP BY landing_page_url WITH TOTALS
DURING today
Product-Specific Analysis
Query 14: Product Page Conversion (Example)
Shows: Conversion rate for specific product by traffic source
Finds: Product-level conversion issues
Replace 'your-product-handle' with actual product URL slug
FROM sessions
SHOW conversion_rate
WHERE landing_page_path CONTAINS 'products/your-product-handle'
GROUP BY referrer_source WITH TOTALS
SINCE -30d UNTIL today
Query 15: Product Traffic Volume
Shows: Session counts for specific product
Finds: Traffic distribution to key products
FROM sessions
SHOW sessions
WHERE landing_page_path CONTAINS 'products/your-product-handle'
GROUP BY referrer_source WITH TOTALS
SINCE -30d UNTIL today
Phase 3: Historical Comparison Queries
Use these to compare problem dates with normal performance.
Query 16: Specific Date Analysis
Shows: Full funnel metrics for any specific date
Finds: What happened on problem days
Replace date with your target date
FROM sessions
SHOW added_to_cart_rate, reached_checkout_rate, conversion_rate
GROUP BY referrer_source
SINCE 2024-09-07 UNTIL 2024-09-07
ORDER BY conversion_rate DESC
Query 17: Week-Over-Week Comparison
Shows: This week vs last week performance
Finds: Weekly trends and patterns
FROM sessions
SHOW sessions, conversion_rate
SINCE -7d UNTIL today
COMPARE TO previous_period
Query 18: Best Day Baseline
Shows: Performance from your best recent day
Finds: What "good" looks like for comparison
Replace date with your best performing day
FROM sessions
SHOW added_to_cart_rate, reached_checkout_rate, conversion_rate
GROUP BY referrer_source
SINCE 2024-09-01 UNTIL 2024-09-01
ORDER BY sessions DESC
Advanced Diagnostic Queries
These queries help identify complex patterns and multi-variable problems.
Query 19: Traffic Source Quality Score
Shows: All funnel metrics by source with totals
Finds: Full-funnel performance by channel
FROM sessions
SHOW sessions, added_to_cart_rate, reached_checkout_rate, checkout_conversion_rate, conversion_rate
GROUP BY referrer_source WITH TOTALS
DURING today
ORDER BY sessions DESC
Query 20: International vs Domestic
Shows: Conversion split between your country and others
Finds: International traffic impact
Replace 'United States' with your primary country
FROM sessions
SHOW sessions, conversion_rate
WHERE session_country IN ('United States', 'Canada', 'United Kingdom', 'Australia')
GROUP BY session_country
DURING today
ORDER BY sessions DESC
Query 21: Peak Hour Analysis
Shows: Best and worst performing hours
Finds: Optimal timing patterns
FROM sessions
SHOW sessions, conversion_rate
TIMESERIES hour WITH TOTALS
SINCE -7d UNTIL today
ORDER BY conversion_rate DESC
Query 22: Checkout Abandonment Diagnostic
Shows: Where in checkout people quit
Finds: Checkout friction points
FROM sessions
SHOW sessions_with_cart_additions, sessions_that_reached_checkout, sessions_that_completed_checkout, checkout_conversion_rate
GROUP BY referrer_source WITH TOTALS
DURING today
Query 23: Search Traffic Landing Pages (Today)
Shows: All pages where search traffic lands today
Finds: SEO/SEM targeting accuracy
Benchmark: 80% should land on product/collection pages, not homepage
FROM sessions
SHOW sessions, conversion_rate
WHERE referrer_source = 'search'
GROUP BY landing_page_url WITH TOTALS
DURING today
ORDER BY sessions DESC
Query 24: Social Traffic Landing Pages (Today)
Shows: Where social campaigns are sending traffic today
Finds: Social ad targeting effectiveness
Benchmark: Each campaign should have dedicated landing page
FROM sessions
SHOW sessions, conversion_rate
WHERE referrer_source = 'social'
GROUP BY landing_page_url WITH TOTALS
DURING today
ORDER BY sessions DESC
Query 25: Top Products Performance
Shows: Conversion rates for your most visited products
Finds: Hero products that aren't converting
Benchmark: Top products should convert at 2x site average
FROM sessions
SHOW sessions, conversion_rate
WHERE landing_page_type = 'product'
GROUP BY landing_page_url WITH TOTALS
DURING today
ORDER BY sessions DESC
LIMIT 20
Query 26: Collection Page Performance
Shows: How collection pages convert vs product pages
Finds: Navigation and discovery issues
Benchmark: Collections should convert at 50-70% of product pages
FROM sessions
SHOW sessions, conversion_rate
WHERE landing_page_type = 'collection'
GROUP BY landing_page_url WITH TOTALS
DURING today
ORDER BY sessions DESC
Query 27: New vs Returning Visitor Conversion
Shows: Conversion differences between new and returning visitors
Finds: First impression problems or loyalty issues
Benchmark: Returning visitors should convert 2-3x higher
FROM sessions
SHOW sessions, conversion_rate
GROUP BY new_vs_returning WITH TOTALS
SINCE -7d UNTIL today
Query 28: Product View to Add-to-Cart Rate
Shows: How many product viewers add to cart
Finds: Product page optimization opportunities
Benchmark: Should be 8-12% for good product pages
FROM sessions
SHOW sessions, added_to_cart_rate
WHERE landing_page_type = 'product'
GROUP BY referrer_source WITH TOTALS
DURING today
ORDER BY sessions DESC
Query 29: Top Non-Converting Landing Pages
Shows: High-traffic pages with zero conversions
Finds: Your biggest problem pages
Benchmark: No page with 100+ sessions should have 0% conversion
FROM sessions
SHOW sessions, conversion_rate
GROUP BY landing_page_url
HAVING sessions > 50 AND conversion_rate = 0
DURING today
ORDER BY sessions DESC
LIMIT 10
Query 30: Weekend vs Weekday Performance
Shows: Conversion patterns by day of week
Finds: Day-specific issues or opportunities
Benchmark: Weekend should be within 20% of weekday
FROM sessions
SHOW sessions, conversion_rate, added_to_cart_rate
GROUP BY day_of_week WITH TOTALS
SINCE -30d UNTIL today
ORDER BY day_of_week ASC
Query 31: Cart Abandonment by Value
Shows: How cart value affects abandonment
Finds: Price threshold issues
Benchmark: Higher value carts should have lower abandonment
FROM sessions
SHOW sessions_with_cart_additions, reached_checkout_rate, checkout_conversion_rate
WHERE sessions_with_cart_additions > 0
GROUP BY referrer_source WITH TOTALS
SINCE -7d UNTIL today
ORDER BY sessions_with_cart_additions DESC
Query 32: Email Campaign Performance
Shows: How email traffic converts vs other sources
Finds: Email list quality and campaign effectiveness
Benchmark: Email should convert at 3-4% minimum
FROM sessions
SHOW sessions, conversion_rate, average_order_value
WHERE referrer_source = 'email'
GROUP BY landing_page_url WITH TOTALS
SINCE -30d UNTIL today
ORDER BY sessions DESC
Quick Diagnostic Framework
- Conversion tanks? → Run Queries 1-7 (Phase 1)
- Mobile issue? → Run Queries 8-9
- Landing page problem? → Run Queries 10-13
- Product-specific? → Run Queries 14-15 (edit product handle)
- Need comparison? → Run Queries 16-18
- Complex pattern? → Run Queries 19-22
Most Common Patterns We Find:
- Mobile social catastrophe: Facebook/Instagram mobile traffic converting at 0.2% while desktop hits 3%
- International dilution: 40% of traffic from countries you don't ship to affordably
- Landing page mismatch: Ad traffic hitting homepage instead of product pages
- Time-based technical issues: Conversions die after 6pm due to app conflicts
- Source quality degradation: Referral traffic quality drops when affiliates send bad traffic
Save These as Custom Reports
Don't re-type these during emergencies. In Shopify Analytics:
- Run any query above
- Click "Save as report"
- Name it clearly (e.g., "EMERGENCY: Funnel by Source")
- Access instantly from Reports → Saved reports
The 15-Minute Diagnostic Process
When conversion drops:
- Minutes 1-5: Run Phase 1 queries (1-7). Identify WHERE the problem is.
- Minutes 6-10: Run targeted Phase 2 queries based on findings.
- Minutes 11-15: Run comparison queries to confirm the pattern.
You'll know exactly what's broken and can fix it instead of guessing.
Need Help Interpreting These Results?
Sometimes the data shows problems but not solutions. That's where pattern recognition comes in.
We've run these queries thousands of times and know what patterns to look for.
Get Your Free AnalysisAbout AxiomState
We specialize in finding the hidden 30% of revenue Shopify stores leave on the table. Not through generic "best practices" but through pattern recognition and systematic diagnostics. These queries are part of our standard diagnostic toolkit.