
The $2M Subscription Trap: Why 72% of Shopify Brands Lose $150K Annually to Hidden App Costs
Published: January 10, 2025
You're reviewing your Shopify analytics over coffee. Subscription revenue just crossed $170,000 last month. You should be celebrating—that's over $2M annually. Instead, you're staring at a number that doesn't make sense: your tech stack is consuming $8,400 monthly.
The subscription app alone costs $2,169. Add payment processing, email marketing, loyalty programs, and suddenly you're hemorrhaging 5% of revenue before shipping a single product.
Here's what most merchants don't realize: you just crossed the $2M threshold—the precise point where subscription apps transform from growth enablers into profit vampires.
The Pattern We Discovered
Below $2M: Apps provide leverage, enabling growth without technical investment
At $2M: Transaction fees hit $20-26K annually, operational workarounds consume 20-30 hours weekly
Above $2M: Every additional million in revenue increases app burden by $15-20K while custom solutions remain flat

The Hunter vs. The Gatherer: Two Merchants, Same Problem
Meet Sarah, the Hunter. She runs a $2.1M supplement brand. When her subscription app bill arrived showing $2,200 for the month, she immediately started shopping alternatives. Loop promised 25% savings. Skio offered better analytics. Bold claimed easier management.
Meet Marcus, the Gatherer. He operates a $2.3M coffee subscription. Same monthly bill, different response. He started documenting every workaround his team performed—the manual invoice adjustments for B2B customers, the CSV exports for customer segmentation, the 3-hour weekly reconciliation between subscription and inventory systems.
Sarah spent three months evaluating apps. Marcus spent three months documenting requirements.
Sarah saved $520 monthly by switching to Loop. Marcus eliminated $4,300 monthly in total costs by building custom.
The difference? Marcus recognized he wasn't buying software—he was renting revenue infrastructure.
The Mathematics No One Talks About
Quick Navigation
The Compound App Tax Reality
Let's dissect actual costs at $2M revenue (assuming 50% from subscriptions):
Visible Costs:
- Recharge Pro: $499 base + 1.25% of $1M = $1,458/month
- Skio: $599 base + 1% of $1M = $1,433/month
- Loop: $399 base + 0.75% of $1M = $1,024/month
Seems manageable? Here's what compounds:
The Full Stack Burden:
- Subscription app: $1,458
- Payment processing (2.9% + $0.30): $2,900
- Klaviyo (email/SMS): $700
- Loyalty program: $299
- Reviews app: $199
- Analytics tools: $200
- Support tools: $300
Monthly total: $6,056
Annual drain: $72,672
Percentage of revenue: 3.6%
But we're not done.

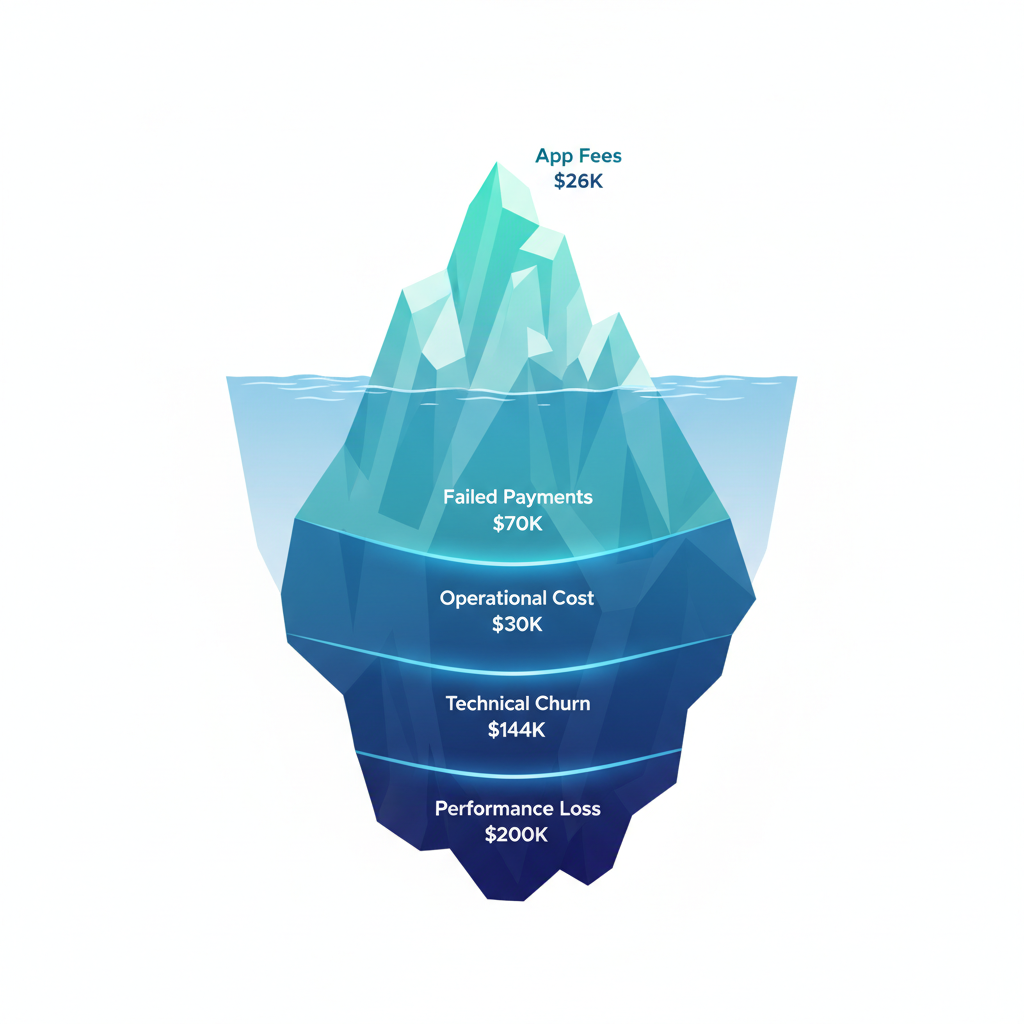
The Hidden Costs That Actually Kill You
1. Failed Payment Recovery Gap
Your subscription business loses 7% of charges to failed payments on first attempt. At $1M subscription revenue, that's $70,000 at risk monthly.
- Basic app recovery: 15% success rate = $59,500 lost
- Advanced custom recovery: 60% success rate = $28,000 lost
- Annual difference: $31,500
2. The Migration Trap
Currently on Recharge? Switching to Loop requires:
- 6 hours of work per 200 subscriptions
- 2-4 weeks running both apps (double fees)
- 5-10% subscriber loss during transition
- True switching cost: $8,000-15,000
3. Technical Churn
20% of cancellations cite "difficulty managing subscription." At 5% monthly churn on 1,000 subscribers:
- 50 monthly cancellations
- 10 due to poor UX
- 120 annual preventable losses
- Revenue impact: $144,000/year
4. Performance Degradation
Each app adds 124ms to load time. Your 12-app stack adds 1.5 seconds. Impact:
- 7% conversion drop per second
- 10.5% total conversion loss
- On $4M total revenue: $420,000 annual loss
Total hidden costs: $615,500 annually
See Your Actual Revenue Leakage
Get a personalized analysis of your subscription infrastructure costs
Calculate Your Hidden CostsThe Breakeven Calculation That Changes Everything
Custom Development Investment:
- Initial build: $50,000-100,000
- Annual maintenance: $25,000
- API compliance: $12,000
- Total Year 1: $87,000-137,000
- Years 2-5: $37,000/year
Five-Year Comparison at $2M Revenue:
| Scenario | Subscription Apps | Custom Solution | Difference |
|---|---|---|---|
| Direct fees | $86,400 | $0 | $86,400 |
| Hidden costs | $615,500 | $154,000 | $461,500 |
| Maintenance | $0 | $185,000 | -$185,000 |
| 5-Year Total | $3,509,500 | $339,000 | $3,170,500 saved |
The math is undeniable: custom solutions generate 934% ROI over five years.

Why Shopify's 2025 Updates Changed Everything
December 2024: Shopify released their Subscriptions Reference App—complete open-source code for building custom subscriptions. This single move:
- Reduced development time by 40-60%
- Dropped costs from $100-150K to $50-90K
- Provided production-ready architecture
- Eliminated technical uncertainty
Combined with checkout extensibility maintaining Shop Pay's 1.72x conversion advantage, custom solutions no longer sacrifice conversion for control.
Quick Win Opportunity
Skip straight to our calculator below to get your personalized subscription analysis in 30 seconds.
Calculate Your ROI NowThe Features You Can't Buy
At $2M revenue, you need capabilities no app provides:
- Dynamic B2B pricing by customer segment
- Consumption-based billing for usage models
- Multi-location inventory allocation for fulfillment optimization
- ERP integration with NetSuite, SAP, or Dynamics
- Advanced dunning with multi-channel recovery
- Predictive churn models using your data
Building these as app customizations costs $15-50K per feature. Building them native? Included in your custom solution.

Shopify Flow Automation: Quantified Time Savings
Flow enables no-code workflow automation that eliminates repetitive tasks. Here are the five highest-ROI workflows with actual time savings:
1. Fraud prevention and high-risk order flagging
- Current time: 10 hours weekly reviewing orders
- After automation: 3 hours weekly
- Savings: 7 hours × $30/hour × 52 weeks = $10,920 annually
2. VIP customer identification and rewards
- Current time: 5 hours weekly tagging and emailing
- After automation: 0 hours (fully automated)
- Savings: 5 hours × $30/hour × 52 weeks = $7,800 annually
3. Inventory restock management
- Current time: 8 hours weekly monitoring 500 SKUs
- After automation: 2 hours weekly
- Savings: 6 hours × $30/hour × 52 weeks = $9,360 annually
Total annual value from automation: $28,080
Your Decision Framework
Stay with Apps If:
- Monthly subscription revenue < $75,000
- Standard replenishment model only
- No B2B requirements
- Budget < $500/month for subscription tools
- Need solution within 30 days
Consider Custom If:
- Monthly subscription revenue > $75,000
- B2B represents 20%+ of revenue
- Hitting app feature ceilings
- Team spends 20+ hours weekly on workarounds
- Planning to scale beyond $5M
Move to Custom Immediately If:
- Monthly subscription revenue > $150,000
- Transaction fees alone exceed $2,000/month
- B2B/wholesale is strategic priority
- Competition uses custom solutions
- Technical debt blocking growth
Get Your $2M Threshold Analysis
We'll analyze your exact subscription economics and show you:
- Your true all-in subscription costs
- Hidden revenue leakage points
- Custom vs. app 5-year comparison
- Specific ROI timeline for your business
The Six Numbers That Matter
Your decision distills to six critical metrics:
- $20,000-26,000 - Annual transaction fees at $2M
- 5-7% - Total revenue consumed by app stack
- $50,000-120,000 - Failed payment losses at risk
- 20-30 hours - Weekly operational workarounds
- $40,000-200,000 - Technical churn impact
- 6-18 months - Custom solution payback period
The Uncomfortable Truth
If you're operating at $2M+ revenue on standard subscription apps, you're likely sacrificing $150,000-400,000 annually through compound inefficiencies.
The visible app fees? They're just 10-15% of true costs.
The other 85-90% hides in:
- Failed payments not recovered
- Hours spent on manual processes
- Subscribers lost to friction
- Growth constrained by limitations

Your Next 30 Days
Week 1: Audit Reality
- Calculate total subscription app costs
- Document operational workarounds
- Measure failed payment recovery rates
- Identify feature limitations blocking growth
Week 2: Build Your Model
- Project revenue growth next 24 months
- Calculate 5-year TCO current vs. custom
- Identify must-have custom features
- Estimate ROI timeline
Week 3: Evaluate Options
- If staying with apps: Migrate to Loop (save 25%)
- If going custom: Start with Reference App
- If uncertain: Get external analysis
Week 4: Make Decision
- Below $1.5M: Optimize current apps
- $1.5M-2.5M: Begin custom planning
- Above $2.5M: Execute custom immediately
FAQ
Q: What if my subscription revenue is only 30% of total revenue?
A: The threshold shifts to approximately $3.3M total revenue. The math remains similar—once subscription revenue exceeds $1M annually, evaluation begins.
Q: Can't I just negotiate better rates with apps?
A: Premium apps rarely negotiate below 0.75% transaction fees. Even at best rates, you're still paying percentage-based fees that scale with growth.
Q: What about hybrid approaches?
A: Increasingly viable. Use Shopify's native subscriptions for basics, build custom customer portal and business logic. Reduces development to $30-50K.
Q: How risky is custom development?
A: With the Reference App, risk dropped 70%. You're not building from scratch—you're customizing Shopify's proven architecture.
Q: What about Shopify's native subscriptions?
A: Free but limited. No B2B features, basic portal, minimal customization. Fine for testing, insufficient for scaling.
The Pattern Is Clear
The $2M threshold isn't arbitrary. It's where:
- Transaction fees become painful
- Operational complexity demands better systems
- Cash flow enables strategic investment
- Competition requires differentiation
Merchants who recognize this pattern at $2M position for profitable scaling to $5M, $10M, and beyond.
Those who delay? They pay millions in unnecessary fees while competitors build competitive advantages.
The math is clear. The pattern is proven. The only question is timing.
Ready to Stop the Revenue Leak?
Join 50+ brands that discovered their hidden subscription costs
Average finding: $127,000 in annual savings opportunities
Get Your Revenue Gap Analysis15-minute assessment • No sales pressure • Actual data from your store